Public schooling data in Massachusetts tells a tale of two states. In one, surging household incomes coupled with ample taxable property provide for peerless public education. In the other, an aspiring citizenry must surmount the same barriers as ever.
Before their summer recess, state lawmakers saw fit to distribute $50 million regressively to the haves through a record setting minimum aid increment. Of that haul, $32.8 million went to districts that can afford more than the maximum local share set by state law. Capped districts will rake in $1.27 billion of school aid this year, 18.5% of the total.
At one extreme, Provincetown can afford its state-mandated foundation budget 12 times over. This year, the outermost beachhead of Cape Cod received $314,500 in state aid to educate 137 students. That money helped Provincetown’s public schools outspend its requirement by a factor of four. Even so, the schools’ ELA and Math MCAS scores trailed state averages.
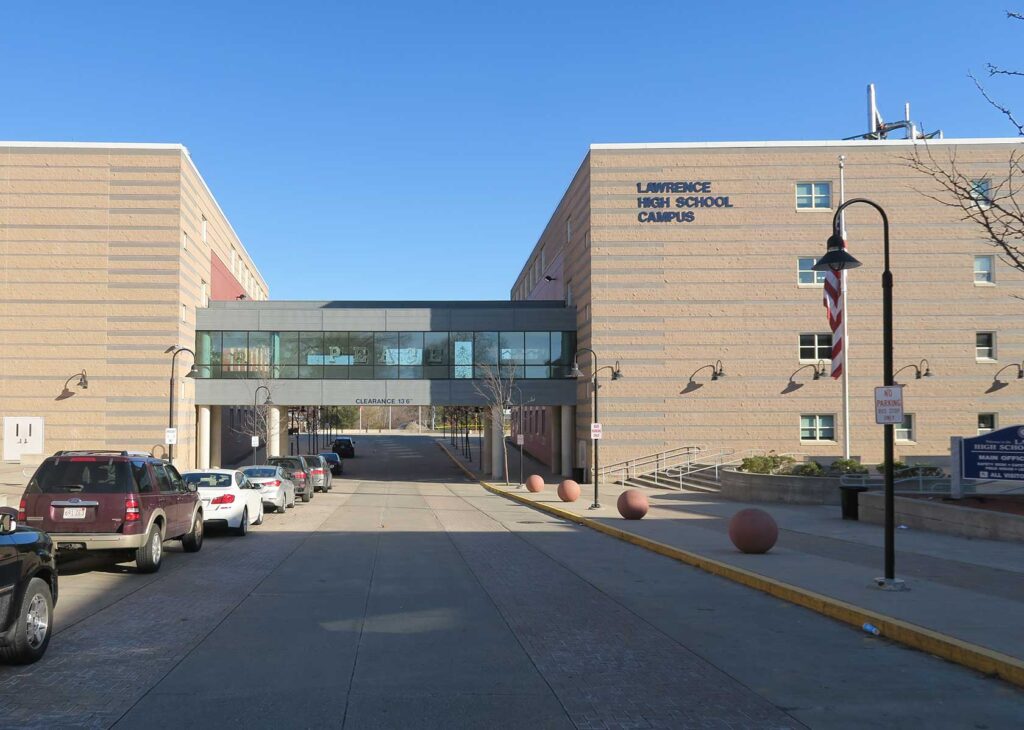
Springfield and Lawrence are the furthest opposite. Each can afford 16% of their foundation budget. And so, their state aid is astronomically higher — out of proportion to student enrollment. However, Springfield’s actual school spending was $2 short of the minimum allowed, Lawrence spent 4% under it. Educating 90% high needs students, both districts have higher class sizes.
To understand our stratification beyond outliers, The Banner analyzed groups of public school districts based on their net school spending percentage in the last two years.
Along with Provincetown, 27 public school districts exceed the required spending by 200% or more. Educating 26,354 students collectively, they received $69.5 million in school aid for this year. This exclusive cohort operates only five high schools, otherwise regionalizing secondary education with their neighbors.
Alongside Springfield and Lawrence, 44 districts have hovered around the minimum spending level in the last two years. Nine times as populous and heavily invested in secondary education, these districts operate 73 high schools as well as virtual learning and extended engagement programs. Fifteen ag-tech or vocational schools number among this group, which educates just over a quarter of the students in Massachusetts and 47% of the English language learners.
Recent education legislation, the Student Opportunity Act, raised pre-K, elementary and middle-school base rates relatively more than high school or vocational school rates.
Test results differ as expected. Where districts are spending around the minimum level, about a quarter of students are meeting or exceeding expectations on the MCAS through middle school. In high school, that number rises to a third or more. In the wealthier districts more than half obtain the top category in elementary and middle school. Two-thirds to three-quarters do on one of the 10th grade tests.
To control for students’ different starting points, Massachusetts also measures student growth. Each school, district and student subgroup is supposed to reach 50%. The districts contending with the state-minimum spending level nurture 48% growth before high school, followed by 46% in ELA and 42% in Math. Those with means make the mark, more or less, in grades 3 – 8, with 54% growth in their few high schools.
A separate test, ACCESS for ELLs, measures the English skills of immigrants. Administered each year, it assesses their annual progress towards English proficiency within five years. 35% to 40% of students in districts with tight budgets made progress in the last two years. Where resources were abundant, 70% plus kept pace.
Over more than a decade, spending by the wealthiest districts increased faster than the poorer group. Spending 220% of their foundation budget collectively in 2023, they spent just 202% in 2012. The other group’s spending has been pegged to 101% of the state-set level over that same period, only briefly approaching 106% in 2021.
Setting aside the regional and vocational schools, the districts exemplify the divergence in Massachusetts’s economy since 2012. The education formula measures each municipality’s property value and household incomes. Property values in the thrifty group slightly outpaced the state average, led by growth in Chelsea, Everett and Revere. Slower property value growth in Holyoke, Savoy and Chicopee hampered their municipal revenues. Among the prodigal, both property and income grew faster than Massachusetts. Households in Provincetown and Edgartown are especially flush.
By the broadest scale, average class size, both cohorts have improved over that time. But, in the latest data, the well-resourced districts maintain below-average class sizes of 15.6 while the least-resourced are just above average at 17.2. In addition to quantity, teacher quality favors the top-echelon too: 86% of their teachers are considered experienced, while the poorer districts have only 75%. The state average is 81%.
The wealthy were behind on one point, at least. The $1.4 million they received through the minimum aid increment this year fell just short of the $1.6 million that policy will award their peers in need.


